“What we learn from history is that people don’t learn from history.” When investors get either too fearful or too greedy, they sometimes hide behind the notion that “This time it’s different.” Usually they regret it.
– Warren Buffett
The numbers that really matter are the valuations, i.e. how expensive is a company’s share price relative to its earnings, assets, sales, etc.?
To put things in perspective, the average Price/Earnings ratio across the companies in the S&P 500 Index is now 26.36.
Historically, today’s level is nearly 70% more expensive than the S&P 500’s long-term average Price/Earnings ratio.
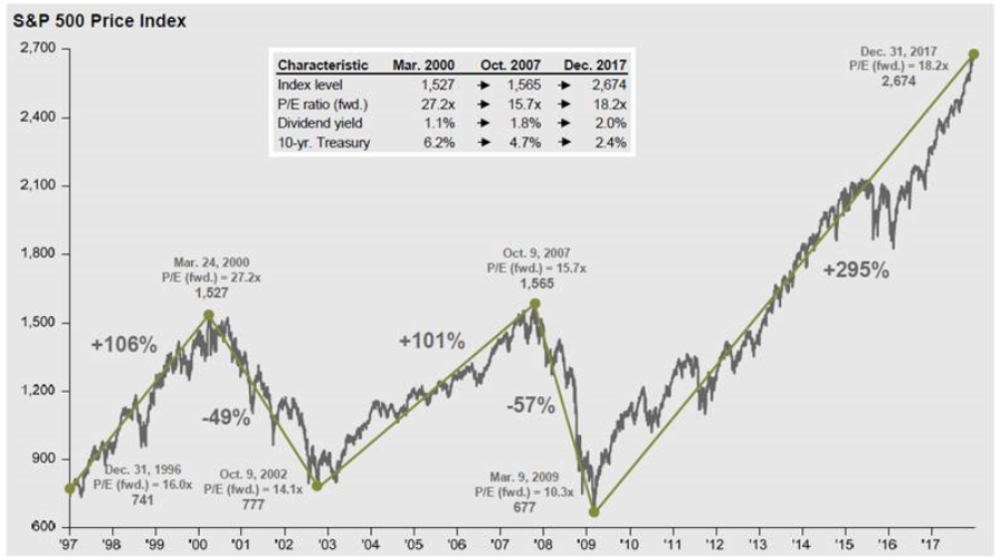
And the only other times in history that it’s consistently been this high were just prior to the 2008 crash, the 2000 crash, and the 1929 crash.
The story is the same looking at other indicators.
The Cyclically-Adjusted Price/Earnings Ratio (or CAPE ratio) which adjusts earnings for inflation over a 10-year business cycle, is now 33.27, more than DOUBLE its long-term average.
In fact it’s only ever been higher ONCE in history– during the dot-com bubble in the late 1990s.
The S&P 500’s average ratio of Price to Book Value is 25% higher than its long-term average. And the average Price-to-Sales ratio across the S&P 500 has never been higher… EVER.
Buying stocks at historically risky valuations isn’t the kind of no-brainer edge that I’m looking for. A much more appealing alternative would be to wait for a major correction, and then gobble up shares of fantastic companies when everyone else is selling.
To be fair, though, this could take a while.
Stock valuations have been anomalously high for the past several years. And they could become even more outrageously overpriced.
All of this leads me to ask myself how you and your family would be affected if your stock portfolio lost half of its value? And would that impact be worse than missing out on another 20% to 50% increase in stock prices?
© Copyright 2026 Palmer Nunn, Inc, All Rights Reserved. | Website Design by WABW Media Group