Because they keep bubbles from forming – but only if you’re prepared
With the stock market’s historic growth that began in early 2009, many believe a 10% pullback may be a healthy thing. Such a drop is not horribly painful, by historical standards, and smart investors can cushion such a fall.
Why is a market correction healthy and beneficial? Because it prevents another bubble from forming. Bubbles occur when stock prices get clearly out of line with the earnings potential of the underlying companies. We saw the consequence of that in the awful 2000 – 02 and 2008 – 09 market wipeouts, when some people lost half their wealth or more.
Certainly, market corrections never feel healthy when they occur. People get fearful as the market declines, the media fan the flames by giving investors reason after reason to be afraid, and worries that this is the beginning of the next crash begin to develop.
While many investors admit that a 5% pullback is manageably unpleasant, concerns expand when the market decline hits 10%. That’s what customarily constitutes a correction. In the most recent sell-off, from January 26th to February 8th of 2018, the Standard & Poor’s 500 index fell 10.2%. We just crept into correction territory, but since that time, the market rebounded and now trades above its early February level.
Author and money manager Ben Carlson looked at the S&P data going back to 1950, and found 28 time periods when stocks fell by 10% or more. Thus, on average, the market has entered an official correction every 2.25 years. The last market correction occurred in early 2018, but another 10% drop in the near future is not unreasonable.
• Total Occurrences: 28 Times
• Average Loss: -21.6%
• Median Loss: -16.5%
• Average Length: 7.8 Months
• Greater Than 20% Loss: 9 Times
• Greater Than 30% Loss: 5 Times
As you can see, the average post – 1950 market correction lasted just under eight months and the median total loss was 16.5%. What about deeper declines? Of the 28 times the S&P 500 decreased by 10%, the market suffered a loss greater than 20% – the standard definition of a bear market – only nine times (32% of the time), and a loss greater than 30% only five times (18%). The data confirm that, although these types of large losses do occur, they really are the exception.
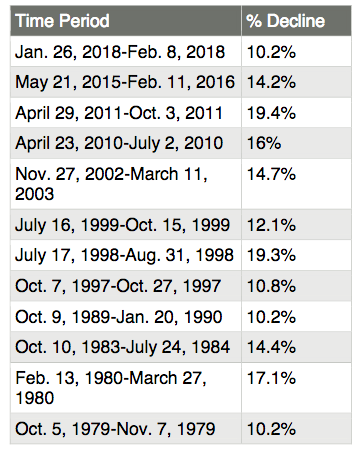
Here are the past 12 corrections in the S&P 500 Index, according to Standard & Poor’s:
Are you thinking: “I don’t think I can stomach that median loss of 16.5%.” Then that’s where the wisdom of diversification becomes apparent. Remember that the data above represent the historical performance of the S&P 500, an index composed of 100% stocks. A capable financial advisor ensures you have an asset allocation mix of stocks, bonds and cash that represents your tolerance for risk. Consequently, your portfolio likely isn’t 100% stocks. In fact, the appropriate allocation for an average investor app
roaching or already enjoying retirement might be closer to only 50% stocks. This means that on average, your portfolio should decline only half as much as the S&P 500 during market downturns.
So, diversification brings our sample (close to or in retirement) investor, with a 50% stock portfolio, down to around 8.25% during the median decline. Are you now back in the “manageably unpleasant” range? If so, you likely have an appropriately constructed portfolio. If not, you may need to reevaluate your risk tolerance to ensure you are not exposing your nest egg to a larger loss than you can endure. Although the recent market pullback might create anxiety, media headlines and possibly fear, remember this: we’ve been here before.
© Copyright 2026 Palmer Nunn, Inc, All Rights Reserved. | Website Design by WABW Media Group